AEGYS MONITOR

Connect it. And see what's really happening on your network.

AEGYS Monitor is a compact appliance that connects to your network in minutes — to a free port on your switch. No rollout. No agents. No interference with running systems. From the moment it's connected, you see what's actually communicating on your network.  Network Detection and Response — delivered as a service, not a project. Analysis where you choose: US or Germany. Built for OT and production networks, too.

The autonomous pentest is explained on its own page → AEGYS Pentest.

The AEGYS Monitor appliance — fits next to any switch. No rack, no install — connect it and it runs.
WHAT AEGYS MONITOR IS

The category in one sentence

Network Detection and Response (NDR) — as a service, with data processed where you choose.

  • NDR, not a SIEM project

    Network Detection and Response as a service — no implementation project and no SOC of your own to build.

  • Passive and non-intrusive

    Connected via SPAN port or TAP. Suitable even for sensitive OT and production networks.

  • Processing where you choose

    GDPR-grade data protection — with analysis on US infrastructure or in Germany, your choice. Relevant for regulated and audit-driven environments.

HOW IT WORKS

Three steps. That's it.

Connect, capture, interpret. What the three steps actually mean.

01

Connect

On your network in minutes

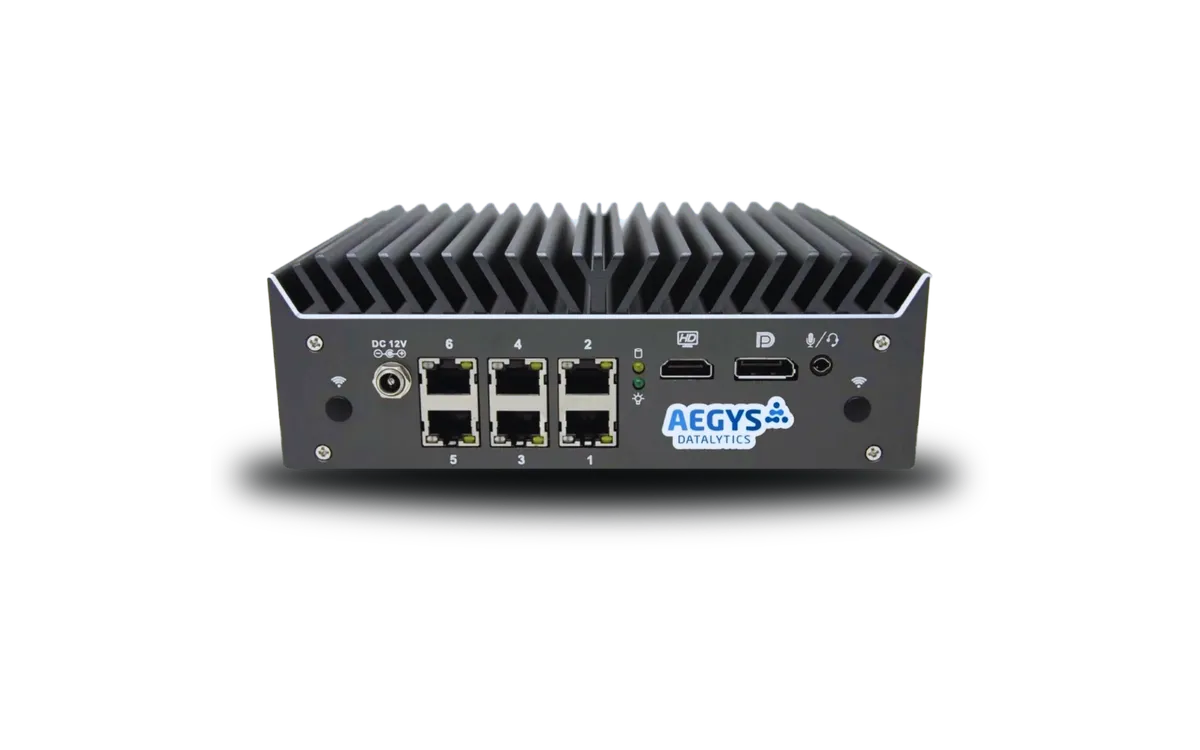
AEGYS Monitor connects passively to your network — via a SPAN/mirror port on your switch or a network TAP. That's all it takes: a free port, a cable. You or your IT provider can do it, typically in five to fifteen minutes. No software on endpoints, no configuration on your systems, no changes to routing or firewall.

Because the connection is purely passive, there's no added load or change on your production systems — the Monitor only reads a copy of the traffic. That's exactly what makes it suitable for OT, production, and SCADA-adjacent networks where no other security tool is allowed to interfere.

We'll determine the right connection point together up front — especially with multiple sites or segmented networks. The rest takes a single step.

Passive connection via mirror copyMain flow left-to-right through switch/router; a dashed branch sends a copy downward to the appliance.Your networkSourceSwitch / Routerruns unchangedDestinationunchangedMirror copy(SPAN / TAP)AEGYS Monitorreads only
Passive capture — the data flow stays untouched.

While your provider is still writing the quote for a SIEM project, AEGYS Monitor already shows you what's running on your network.

No rollout. · No agents. · No firewall rules. · Connect it — and it runs.

SIEM project: weeks to months. AEGYS Monitor: minutes.SIEM PROJECTPlanningLicensesIntegrationTrainingWeeks to monthsAEGYS MONITORConnect ✓Minutes
From unboxing to first view: minutes, not months.
02

Capture

What AEGYS Monitor sees — and what it doesn't

Once connected, it continuously captures connection metadata: source and destination systems, volume, protocols, ports, timestamps. By default, only metadata is captured — no full packet contents.

Extended capture with Deep Packet Inspection or PCAP is technically possible, but optional and only by explicit agreement. Which capture mode fits is a deliberate decision per engagement, not a fixed state.

The captured metadata is transmitted encrypted to the AEGYS analysis environment — located where you choose. We describe exactly where your data sits in the next section.

03

Interpret

Activity becomes a decision

You don't see isolated log entries — you see connections: which internal systems talk to which external destinations? Is there unusual lateral movement? Is there communication that doesn't fit the normal operating picture?

The analysis combines behavioral analytics with curated threat intelligence. On request, we review the findings together with your team — structured, clear, no room for guesswork.

The result isn't a pile of data — it's a reliable read on where you stand right now.

Data flow

Captured on your premises. Analyzed where you choose.

AEGYS Monitor's analysis runs in the location you select — on US infrastructure or in our data center in Germany.
Here's what that means:

Captured on your premises

AEGYS Monitor sits in your network and passively captures network communication, without interfering with production systems.

Encrypted transmission

The captured metadata is transmitted encrypted to your chosen analysis environment. Standard: a TLS-secured outbound connection from the Monitor to the AEGYS platform.

Analyzed where you choose

Processing runs exclusively in the analysis environment you've selected — on US infrastructure or in Germany. No transfer to jurisdictions you didn't pick. No hyperscaler cloud — AWS, Azure, Google Cloud are not involved.

This architecture is a deliberate trade-off: the analysis benefits from continuously maintained threat feeds, behavioral models, and the shared view across multiple customer environments. But your data only ever sits where you agreed — under the legal framework you chose.

On your premisesIn the AEGYS analysis environment (US or Germany)
AEGYS Monitor (hardware)Connection metadata for analysis
Network capture (passive)Structured assessment and history
Monitor configurationUpdated threat intelligence and models

Full details on data processing, the data-processing agreement, and GDPR compliance are available on request.

Concrete result

Real findings from live operation

The analysis isn't a log collection. It's a view of what's actually happening — a basis for decisions.

  • Which internal systems are currently communicating with the internet — and with which destinations.

  • Connections to suspicious or known-malicious hosts (C2 indicators).

  • Unusual lateral movement between internal systems.

  • Data outflows that break the pattern relative to the normal operating picture.

  • How activity shifts against the normal baseline — including after an incident.

Not just data. Connections.

Detection

Why AEGYS Monitor sees what others miss

This combination of behavioral analytics and threat intelligence is the core of Network Detection and Response (NDR) — the continuous detection of suspicious activity at the network level. Classic detection systems catch what they already know. The Monitor works to complement them — with three methods that reinforce each other.

Signature detection

What's known to be an attack

Known attack patterns are caught directly: exploits, malicious protocol anomalies, documented malware indicators, IDS signatures for protocol exploits. It's the fastest answer to threats whose patterns are already described — and the foundation the other methods build on.

Behavioral analytics

What doesn't fit the operating picture

In the first hours of an engagement, AEGYS Monitor learns your network's normal communication behavior: which systems talk to each other, which external destinations are typical, which volumes look normal. From that baseline, it identifies deviations — new external destinations, unusual lateral connections, atypical data flows.

Behavioral analytics also catches activity for which no known signature exists yet. That matters especially after targeted attacks, where adversaries use their own, non-public infrastructure.

Threat intelligence

What's known to be a problem

In parallel, a comparison runs against curated threat-intelligence sources: known-malicious hosts, command-and-control servers, compromised endpoints, suspicious domains. Connections to such targets are flagged — even when they look unremarkable within the network's normal operating picture.

Threat intelligence surfaces threats already identified as such that would otherwise stay hidden in normal noise.

Signature detection without behavioral analytics misses new attacks. Behavioral analytics without signatures creates too much noise. Threat intelligence without both stays theoretical. Only the combination delivers a reliable read.

Data model

Data minimization by default

What data is captured is a deliberate decision per engagement, not a fixed scope.

Capture modeWhat's capturedWhen it makes sense
Standard (metadata)Connection metadata: source, destination, volume, protocol, port, timestampContinuous Monitor operation, reality check, privacy-sensitive environments
Extended (DPI)Metadata plus Deep Packet Inspection: protocol details, selected headersMore detailed analysis on demand, by explicit agreement
Full capture (PCAP)Complete packet captures for defined periodsForensic analysis after an incident, only by explicit agreement

The capture mode is set and documented before the engagement. By default we work with metadata — an extension happens only when the use case requires it and you've explicitly approved it.

Where it fits — and where it doesn't

Where AEGYS Monitor isn't the right tool

An honest list. If you need to solve one of the following, AEGYS isn't the right tool:

  • No real-time blocking

    AEGYS Monitor doesn't block attacks and doesn't replace a firewall or intrusion-prevention system.

  • Not an endpoint system

    The Monitor itself reads network traffic, not endpoint activity — that's what EDR is for. AEGYS doesn't build its own EDR, but can plug your existing endpoint solution in as an additional source and bring it together with the network view.

  • Not a SIEM implementation project

    Classic SIEM implementations are custom projects: use cases written for the specific environment, log sources configured one by one, a dedicated SOC team built up. The Monitor delivers the same platform capabilities as a standard service: pre-configured detection logic, standard connection, joint analysis with the AEGYS team. If you want a custom implementation project, a classic SIEM vendor is the better fit.

  • No vulnerability assessment

    What an attacker could achieve in your environment is shown by → AEGYS Pentest, not the Monitor.

AEGYS Monitor shows what's actually happening on your network — continuously, independently, without a project. It's also the entry point into an open platform that integrates and extends your existing security systems, rather than replacing them.

Engagement modes

Reality check or continuous visibility

Two typical modes follow from how it works. Which fits depends on your situation.

Reality check · entry path

Point-in-time analysis

AEGYS Monitor is deployed for a defined period — typically days to weeks. Afterward you receive a structured analysis as a basis for decisions. Data is deleted per your instructions. The Monitor is removed again — or stays for continued operation.

Typical triggers: after a security incident, on a specific suspicion, before an audit, or as an annual sanity check.

Standard

Continuous visibility — subscription

AEGYS Monitor stays on your network. Analyses run on a cadence agreed with you. The subscription is asset-based, cancelable anytime — no long-term contract lock-in.

Suitable for organizations that want continuous second-pair-of-eyes visibility on their network, without setting up a SIEM project of their own.

A common path in practice: reality check as entry → analysis reveals open questions → transition to continuous operation. We'll clarify which fits in the intro call.

The process

From intro call to ongoing analysis

A five-step timeline — deliberately without hard day counts, because networks and situations differ.

  1. 01

    Intro call

    15 minutes by phone. We understand the situation and check together whether AEGYS fits your case. If not, we say so.

  2. 02

    Technical prep

    Clarifying the details — connection point, logistics, on-site timing. You get a short prep checklist of what we need on connection day.

  3. 03

    Connect

    The Monitor gets connected — a free port on the switch is enough, typically minutes. You or your IT provider can do it; we'll guide you remotely on request. We've agreed the right connection point in advance.

  4. 04

    First insights

    First anomalies are visible within hours. When a reliable assessment is ready depends on network size and activity — often one to a few days.

  5. 05

    Analysis

    We review the findings together: what was found, how to read it, what the next steps are. In continuous mode, analyses repeat on a cadence agreed with you.

Common questions

Technical details at a glance

Still unsure?

See in 2 minutes whether your network has blind spots

Before we talk: the free network check gives you a first orientation in 2 minutes on where your network might have blind spots — anonymous, no data entry.

Start the network check
EXAMPLE CASE

What you actually get

An anonymized example — this is what the analysis of a case looks like.

AEGYS DATALYTICSEXAMPLE — ANONYMIZED

Case 2098 · Suspicious process chain

Score96
Verdict: True Positive
WhatCredential dumping
WhoHost-A · user adm-svc
SeverityCritical
StatusNew
AnalysisDetectionHistory
18 ALERTS · BY TIME
  1. 88Score
    Abnormal parent/child process chain11:32
    a minute
  2. 67Score
    Unusual outbound data flow11:33
    a few seconds
  3. 29Score
    Internal SYN flood pattern11:35
    a few seconds
  4. 12Score
    Failed internal connection attempt11:34
WALKTHROUGH IN THE REVIEW SESSION

Correlated alerts on a single host, grouped into one case. AEGYS makes the connections visible — interpreting them and deciding next steps happens together with you and stays with your IT team or provider.

“Runs in the background, we don't notice it — and that was exactly the point. We wanted visibility without having to look after it ourselves.”
Talk to a customer

If you'd like, we'll arrange a direct conversation with companies already using AEGYS.

No in-house security team, but you have an IT provider?

That's the norm. Often your existing provider can run the ongoing analysis through AEGYS themselves — and if not, a security partner takes it over. We'll clarify what fits in the intro call.

15-minute intro call

See for yourself what's really happening on your network.

15 minutes is enough to clarify whether AEGYS Monitor, AEGYS Pentest, or both fit your situation. No sales call. If it's not a fit, we'll say so openly.

Direct line · no hold queue